KnockoutJS is a popular JavaScript library that is widely used in Magento 2 to handle dynamic UI elements. It provides a convenient way to bind data and update the UI automatically whenever the data changes. However, when working with complex KnockoutJS components, it is not uncommon to encounter bugs or issues that need to be debugged. In this blog post, we will explore how to debug KnockoutJS components in the console using RequireJS in Magento 2.
Prerequisites
Before we dive into debugging KnockoutJS components, make sure you have the following prerequisites in place:
● A working installation of Magento 2.
● A basic understanding of KnockoutJS and RequireJS.
● A basic understanding of browser developer tools.
How is debugging KnockoutJS becoming a challenge in Magento 2?
Debugging Knockout.js in Magento 2 can indeed be challenging due to the complexity of the Magento platform and the way Knockout.js is integrated into it. Here are some of the challenges you may encounter when debugging Knockout.js in Magento 2:
1. Complex Architecture:
Magento 2 has a complex and layered architecture. It uses a combination of PHP, JavaScript, RequireJS, and XML configurations, which can make it challenging to trace the flow of data and identify issues.
2. Knockout.js Integration:
Magento 2 heavily relies on Knockout.js for its frontend components, such as checkout, product pages, and customer account sections. Debugging Knockout.js code can be more challenging than traditional JavaScript because of its declarative nature.
3. Large Codebase:
Magento 2 has a large codebase with numerous JavaScript files and templates. Finding the specific JavaScript code responsible for a particular functionality or issue can be time-consuming.
4. UI Component System:
Magento 2 uses a UI Component system to manage Knockout.js components. These components are defined in XML files, and it can be challenging to track how data flows between the UI components and the backend PHP code.
5. Customization and Extensions:
Magento 2 allows for extensive customization through themes and extensions. Third-party extensions can introduce their own Knockout.js code, which can interact with core Magento functionality and lead to compatibility issues.
6.Asynchronous Loading:
Knockout.js components in Magento 2 often load asynchronously, which means that the order in which they execute may not be immediately obvious. This can make it harder to debug issues related to component initialization and data binding.
To address these challenges and effectively debug Knockout.js in Magento 2, consider the following strategies:
1. Enable Developer Mode
Before we start debugging, it is recommended to enable the developer mode in Magento 2. This can be done by running the following command in the Magento root directory:
bin/magento deploy:mode:set developerEnabling the developer mode will display detailed error messages and enable debugging tools
2. Locate the KnockoutJS Component
Once the developer mode is enabled, the next step is to locate the KnockoutJS component that needs to be debugged. In Magento 2, the KnockoutJS components are defined in JavaScript files located in the view/frontend/web/js directory of the module.
Use the RequireJS module name of the component to locate the corresponding JavaScript file. For example, if the component is defined in a file named my-component.js and the module name is Vendor_Module/js/my-component, then the JavaScript file can be found at Vendor/Module/view/frontend/web/js/my-component.js.
3. To debug KnockoutJs in the console using RequireJS
Let’s use the checkout page as an example,
- Launch your web browser and access the Checkout page that includes your KnockoutJs component.
- To access your web browser’s developer tools, you can typically do so by right-clicking on the page and choosing “Inspect” from the context menu, or by pressing the F12 key.
- Go to the “Console” tab within the developer tools. Here, you can execute JavaScript code and view any error messages or console output.
- As Magento 2 relies on RequireJS for module loading, it’s essential to load the Knockout.js library and any other required dependencies before debugging. You can achieve this by executing the necessary RequireJS `require` statements in the console.
- In the example below, I will demonstrate how to load the “quote” component in the console:
Syntax:
require(['component'], function (value) {
window.value = value;
});
Example:
// Load the "quote" component using RequireJS
require(['Magento_Checkout/js/model/quote'], function(quote) {
// Now you have access to the "quote" component
window.quote = quote;
});
The above code in your web browser’s console will load the Magento_Checkout/js/model/quote module, making it accessible for further use or debugging within the browser environment.
I’ve assigned the quote data to `window.quote` here, but feel free to adapt your JavaScript code according to your specific needs.
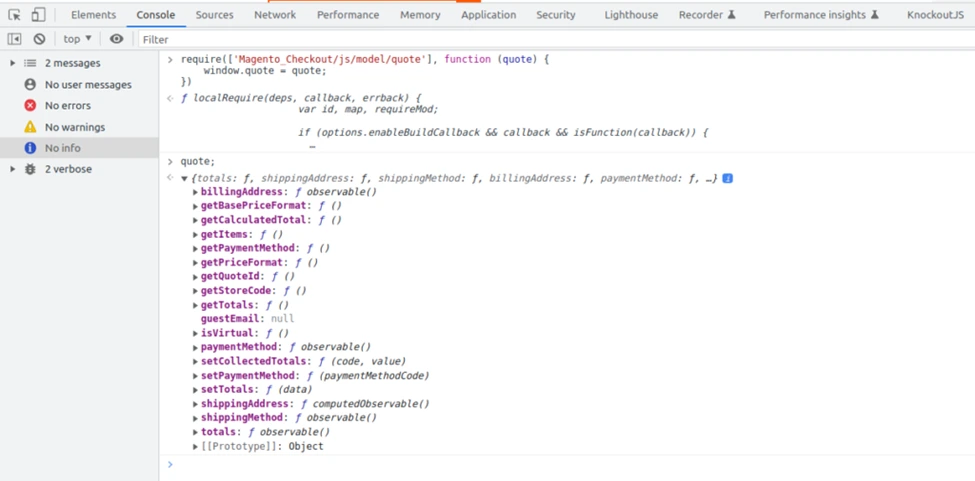
Now, you can utilize `quote` to display the quote components.
quote;Sample output:

In the sample output provided above, you can observe all the items of the quote model.
Let’s compile a list of all the items available in the quote model.
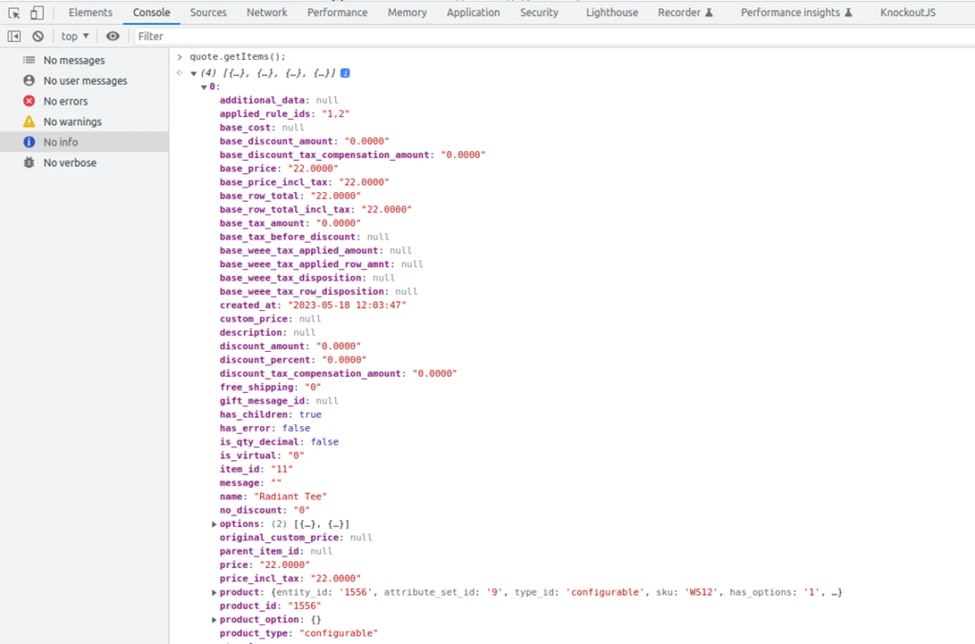
To display all quote items, you can use the following:
quote.getItems();Sample output:


In the snapshot above, you can get all the necessary data about your quote items.
For better clarity, let’s attempt to print the product name of the first quote item:
quote.getItems()[0].name;Similarly, you can retrieve any of the values available in the model using the same approach.
Benefits of Debugging KnockoutJS Components in the Browser’s Console
1. Easy Access to Errors and Warnings
When something goes wrong with your KnockoutJS code, the browser’s console is the first place to look for error messages and warnings. It provides a detailed stack trace that helps you pinpoint the exact location of the issue. By examining the error message, you can quickly identify the cause of the problem and take appropriate action.
2. Inspecting and Modifying Data Bindings
Data bindings are at the core of KnockoutJS. They allow you to establish a connection between your UI elements and the underlying data model. In the browser’s console, you can inspect the current state of your data bindings and make changes on the fly. This is particularly useful when you want to test different scenarios or troubleshoot issues related to data binding.
3. Real-time Debugging
One of the biggest advantages of using the browser’s console for debugging KnockoutJS components is the ability to make live changes to your code. You can modify your code in real time and immediately see the results in the browser. This makes the debugging process much faster and more efficient, as you don’t need to constantly refresh the page to test your changes.
4. Performance Analysis
The browser’s console provides a wealth of information about the performance of your KnockoutJS code. You can use the console to measure the execution time of your functions, track memory usage, and identify any potential bottlenecks. By analyzing this data, you can optimize your code and improve the overall performance of your application.
5. Logging and Debugging Statements
The console is not just for displaying error messages. It can also be used to log important information and debug statements. By adding console.log statements to your code, you can track the flow of execution and monitor the values of variables at different points in your application. This can be particularly useful when you’re trying to understand how your KnockoutJS components interact with each other.
Conclusion
Debugging KnockoutJS components in the console using RequireJS in Magento 2 is a straightforward process that can help developers identify and fix issues quickly. By following the steps outlined in this blog post, you can effectively debug your KnockoutJS components and ensure a smooth user experience on your Magento 2 website.


